Covariance
Type
Comparison indicator
Description
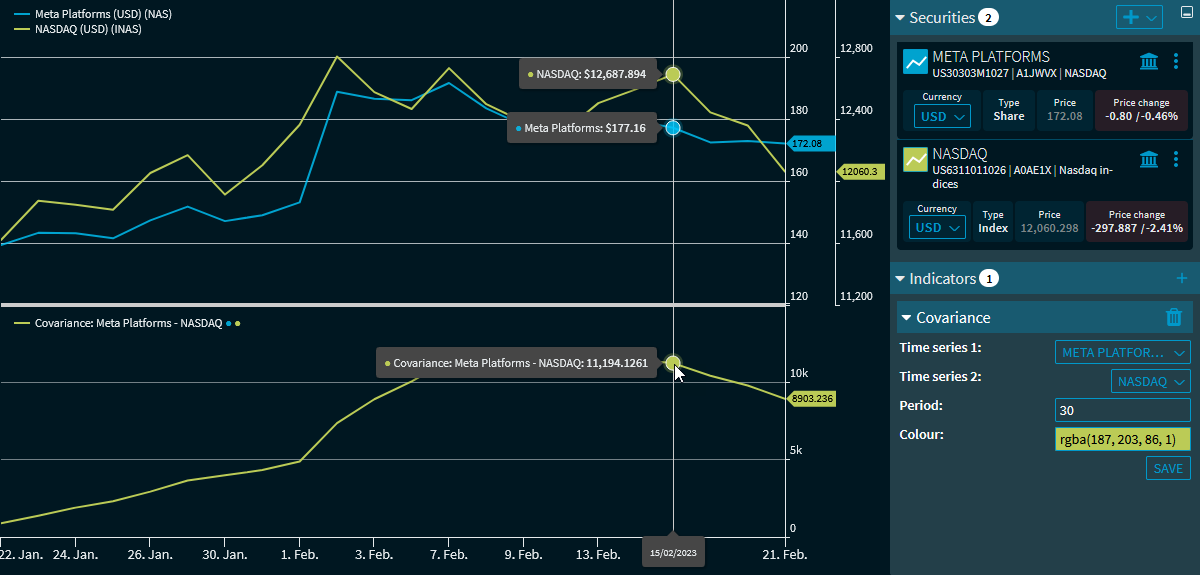
The "Covariance" indicator calculates the covariance between two securities. This means that at least two securities (or at least two time series) must be displayed in the "Chart analysis" widget. In the indicator settings, select the corresponding time series or securities.
The covariance shows the relation of two values. A positive covariance means a positive dependence, a negative covariance means an inverse relationship of the two values.
Formula/calculation
Cov(x,y) = Σ [(xi - xm) * (yi - ym)] / (n - 1)
where:
xi = one data point (expression)
xm = The average of the x data points
yi = a data point corresponding to data point xi
ym = The average of the y data points
n = number of data points
Parameter
- Time series 1
- Time series 2
- Period: The default setting is 30 periods
Example: Covariance