Key Figures
In this widget, you monitor the performance indicators of securities for various periods.
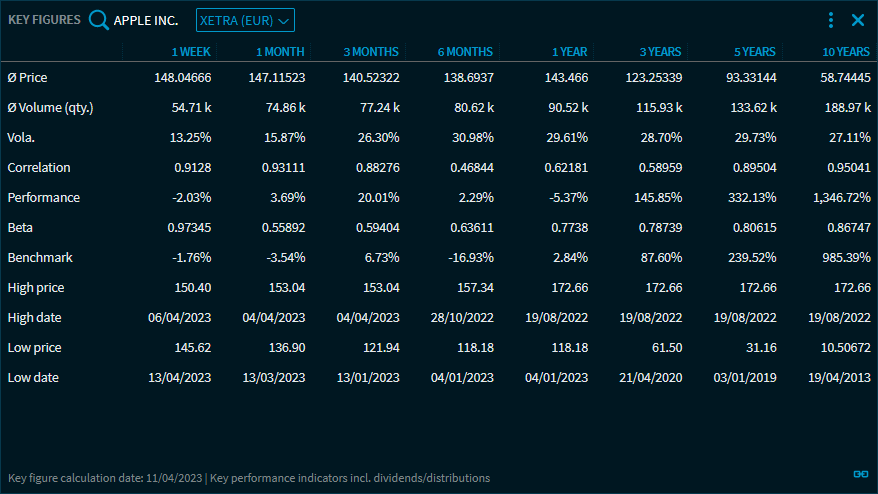
At the top of the "Key Figures" widget, you find the quick search and drop-down lists to select the security and the corresponding trading venue.
The following periods are shown in the table columns, respectively:
- 1 week
- 1 month
- 3 months
- 6 months
- 1 year
- 3 years
- 5 years
- 10 years
For these periods, the following indicators are calculated:
ID | Description |
|---|---|
| Ø Price | The average price of the instrument on the trading venue in the corresponding period. |
| Ø Volume (qty.) | The average volume of the security on the trading venue in the corresponding period in units (quantity). |
| Vola. | The volatility of the security in the corresponding period. |
| Correlation | The correlation of the security in the corresponding period. |
| Performance | The performance of the security in the corresponding period. |
| Beta | The beta of the security in the corresponding period. |
| Benchmark | The performance of the benchmark in the corresponding period. In brackets, you see the name of the benchmark. |
| Price high | The highest price in the corresponding period. |
| Date high | The date at the highest price in the corresponding period. |
| Price low | The low price in the corresponding period. |
| Date low | The date at the lowest price in the corresponding period. |
| Footer | In the footer of the widget, you find the following information:
|
You can open the "Key Figures" widget for all security types showing the corresponding indicators. Widget grouping and drag-and-drop of securities is also supported.
In the Widget Gallery, you find the "Key Figures" widget in the "Other" section of the corresponding asset class.