Show indicators
In the "Chart analysis" widget, you can display various technical indicators.
To show an indicator:
- Click the "Add indicator" icon in the instrument selection section on the right side of the widget.

- Then select the indicator in the "Indicators" dialogue window that appears.

- If you display several securities (time series) in the chart, select the time series to which the indicator is to be applied as the next step in the dialogue window that appears.

- Define the parameters below, if necessary. However, you can also edit the default settings later. For more information, see Edit indicators.
- Click the "Add" button.
This displays the indicator chart window.
Behind the "Indicators" menu entry, you can see the number of indicators currently displayed. The indicators are listed with their abbreviations in the expanded indicators menu. Point to the abbreviation to see the name with parameters set: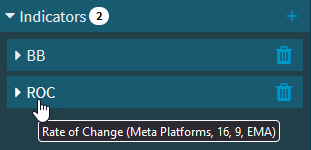
Expand the individual indicators in this list to see the detailed settings and edit them if necessary.