Historical Prices
With the "Historical data" widget, you can see detailed historical data for securities.
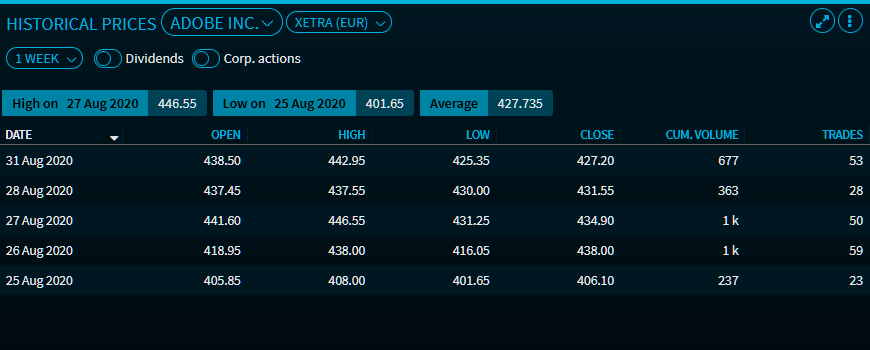
The "Historical Prices" widget provides the following functions and data:
Field | Description |
|---|---|
Select security | Use the search field in the upper left corner of the widget to search and select a security. Alternatively, you can add a (new) security by dragging it from securities lists to the "Historical price data" widget. |
Select trading venue | Use the drop-down list to select a trading venue. |
Select period | Use the drop-down list to select a period for the historical data that you want to see. The following menu items are available:
In addition, you can set a user-defined period in the "Apply custom date" area. To do this, enter a start date in the "Start date" field and/or an end date in the "End date" field using the integrated calendar. |
Select price | For bonds, you can switch between "Price" and "Yield". |
Dividends | Turn this toggle on to include the dividends accrued in the period. The historical price data before this date changes accordingly. |
Corporate actions | Turn this toggle on to include the corporate actions accrued in this period. The historical price data before this date changes accordingly. |
"High" field | Shows the highest price of the selected period and the date of the highest price. |
"Low" field | Shows the lowest price of the selected period and the date of the lowest price. |
"Average" field | Shows the average price of the selected period. |
"Date" column | The price date. By default, the table is sorted by this column, that is, the most recent prices appear at the top of the table. You can reverse the sorting order by clicking the column header again. |
"Open" column | The opening price at the corresponding date. |
"High" column | The daily highest price at the corresponding date. |
"Low" column | The daily lowest price at the corresponding date. |
"Close" column | The closing price at the corresponding date. |
"Cum. volume" column | The trading volume at the corresponding date. |
"Trades " column | The number of trades on the corresponding date. |
"Currency" column | The price currency. This column is hidden by default. In the Settings dialogue window, you can hide or show all columns with historical price data. |
Note that the number of data points that can be displayed in the widget is limited. If you want to list data for very long periods of time, use the CSV export, which you can start via the menu icon.
In the Widget Gallery, you can find the "Historical prices" widget in the "Standard" section of the widgets for indices.