Funds Comparison - Risk
From the drop-down list at the top, select the "Risk & Performance" view to display the most important performance and risk key indicators for the funds selected.
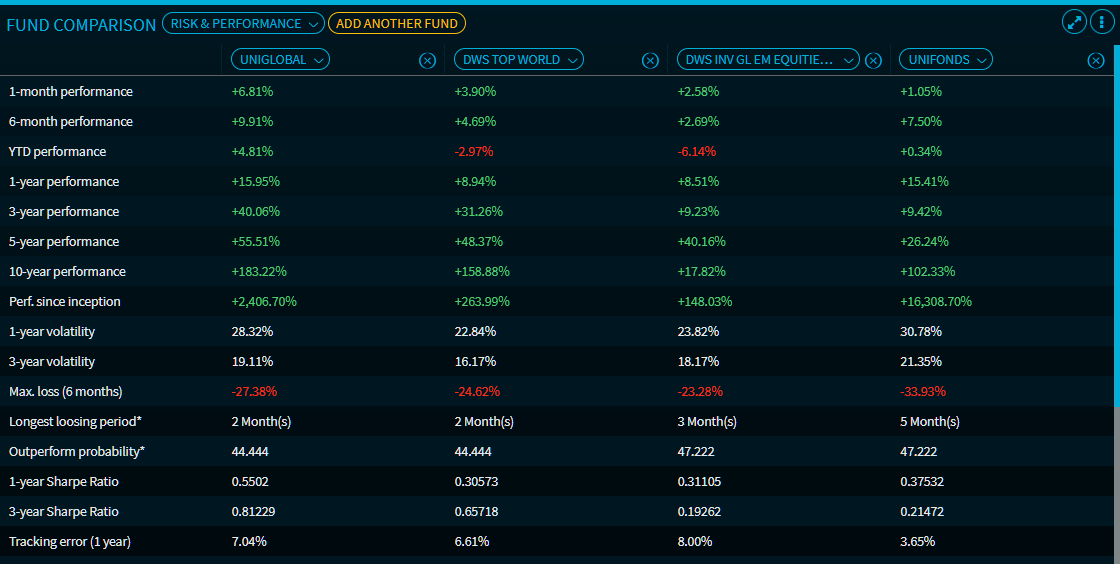
The key indicators in detail:
- 1-month performance
- 6-month performance
- Performance YTD
- 1-year performance
- 3-year performance
- 5-year performance
- 10-year performance
- Performance since launch
- 1-year volatility
- 3-year volatility
- Max. loss (6 months)
- Longest loss period (monthly on a 3-year basis)
- Outperformance probability (3 years)
The probability of outperformance is defined as the ratio of the number of periods with positive outperformance to the number of observation periods n within a range of n periods. - 1-year Sharpe ratio
- 3-year Sharpe ratio
- Tracking error (1 year)
The tracking error is defined as the annualised standard deviation over n sample periods of the difference time series of security performance and underlying security performance (see preliminary comment). - Jensen's Alpha (1 year)
Jensen's alpha can be used as an evaluation criterion for the performance of the management (of a fund) with regard to the risk-adjusted benchmark yield. A positive Jensen's alpha implies an outperformance. The size of the Jensen's alpha indicates the excess return achieved through the active management of the fund manager. - Beta factor (1 year)
To determine the beta, you divide the volatility of the equity by the volatility of the benchmark and multiply this ratio by the correlation between the two assets. - Positive regression
- Negative regression
- Diamond rating
- SCOPE fund rating
- SRRI (Synthetic Risk and Reward Indicator)