Settings on the "Axis" tab
In the "Chart Analysis" widget, switch to the "Axis" tab to configure the display of the x- and y-axes.

The following setting options are available:
| Function | Description |
|---|---|
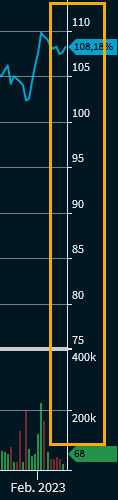
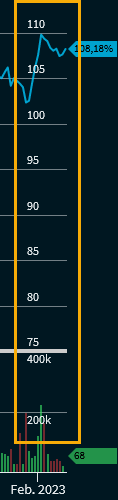
| y-axis outside chart | Use this switch to select whether the y-axis should be displayed "inside" or "outside" the chart. Examples:
For derivatives, two absolute axes are displayed by default for the instrument and the associated underlying. This means that, for example, any barriers or caps that may be present can also be displayed correctly.
|
| Display grid (vertical) | Turn this switch to the right to also display the vertical lines of the grid, which are hidden by default. Example with complete grid:
|
| Display grid (horizontal) | Turn this switch to the left to hide the horizontal lines of the grid displayed by default. |
| Empty data points | Here, you have the possibility to extend the chart on the right side by further (empty) data points into the future, for example to better place trendlines. To do this, turn the switch to the right and enter the number of data points you want to use. Here, the currently set aggregation is taken into account, for example with a daily setting, 100 data points correspond to 100 days in the following example. Example with empty data points:
|