Chart Analysis: Indicators (improvement)
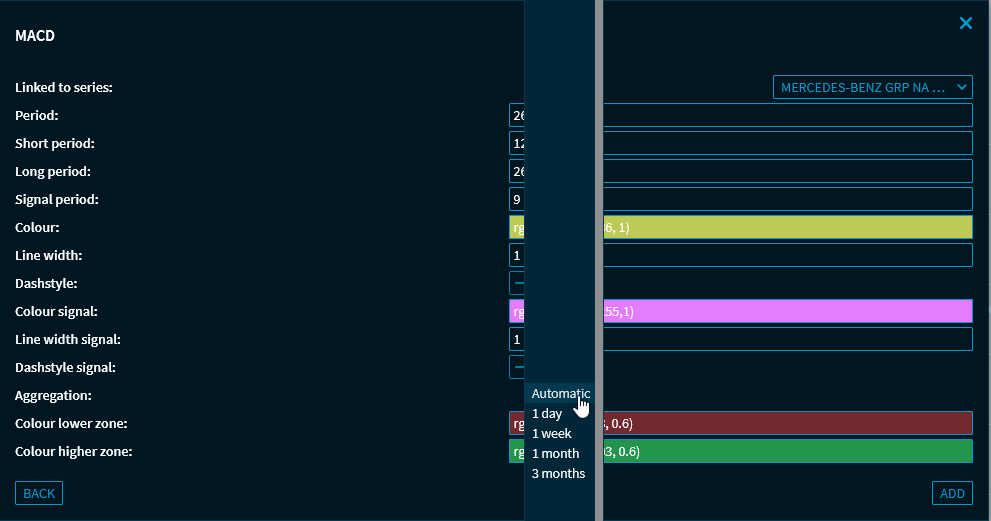
Moving averages (50-, 100- or 200-day) are often used in technical chart analysis. The price that crosses these moving averages can be interpreted as a short or long-term trend change as well as a trading opportunity. Users want to see these moving averages regardless of the time period and/or aggregation set in the chart history. Therefore, in addition to automatic aggregation (default setting), this version now offers the option of selecting 1 day, 1 week, 1 month or 3 months.