Labels

- Go to the "Chart Analysis" widget.
- Click the "Label" button on the left side of the widget.
- In the chart, click the corresponding point in the time series to add a label.
Click the button again to add another label in the widget.
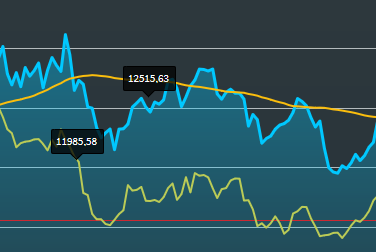
Chart with displayed labels
To learn how to show or hide the labels, see Show or hide annotations.
For more information about working drawing elements, see Edit drawing elements and Delete drawing elements.