Aroon
Type
Trend analysis indicator
Short introduction
The Aroon was developed in 1995 by Tushar Chande. The word "aroon" comes from the Sanskrit language and roughly translates to "dawn’s early light". That is, the indicator was designed to respond sensitively to the first signs of a trend reversal.
The representation of the indicator reverses the usual roles of price and time. While indicators usually show changes in price conditions over time, the Aroon indicator represents the duration of the time elapsed since certain events occurred.
Statement
Based on the idea that uptrends regularly produce new highs and downtrends new lows, Chande wanted to measure and compare the times that have passed since the last high or low occurred. In this way, the course of a trend is illuminated and trend phases can be distinguished from sideways phases.
Formula/calculation
The Aroon is represented in the form of the two curves, Aroon Up and Aroon Down or also as an oscillator. First, the time of the current n-period peak is determined. The Aroon Up is then calculated as the percentage position of this point in time within the n-period interval. The same applies to the Aroon Down in relation to the n-period low point. The Aroon curves thus evaluate extreme points. This evaluation decreases with the increasing age of the extreme points. In short: the more recent the point, the higher their importance.
The Aroon Oscillator is the delta between Aroon Up and Aroon Down.
Aroon
PSHt = Max{ i: 0..n-1 | Ht-i = Maxn(H)t }
PSLt = Max{ i: 0..n-1 | Lt-i = Min(L)t }
Aroon Up = 100 × (1 - PSH÷n)
Aroon Down = 100 × (1 . PSL÷n)
Aroon Oscillator
Aroon Osc = Aroon Up - Aroon Down
where:
PSH = number of periods since the last n-period peak occurred
PSL = number of periods since the last n-period low point occurred
n = number of periods considered
Interpretation
Because an extreme point, as long as it lasts, becomes obsolete by exactly one period per period, the appearance of both Aroon curves is characterised by descending straight lines running at an angle of 45° and vertical ascents at the points of high point change. By moving the window for extreme point observation, the transition to a new extreme point is forced when the previous extreme point leaves the observation interval. The new extreme point is then usually not the newest course, so that the Aroon curves do not necessarily jump to 100% at extreme point changes. The interplay of the Aroon curves shows various patterns. The first reading is to regard the one of the two curves which last assumed a value of 100% as determining for the (possible, coming) trend direction. In pronounced trend phases, the Aroon Up remains above the 70% mark and the Aroon Down below 30%. Falling below the 50% line indicates a weakening of the trend and is often to be interpreted as an indication of coming sharp market movements. A consolidation phase (sideways trend interruption) occurs when both curves fall close to each other in parallel. It is more likely that the lower of the two curves will then determine the trend direction. The Aroon oscillator is somewhat easier to handle. Together with the zero line, it allows you to discover phases in which the Aroon Up notes above the Aroon Down. This represents a further way of assigning upward trends. Crossings of the zero line are therefore to be interpreted as trend changes and good trading signals. In addition to the determination of the trend direction, Chande's indicator is used to interpret the oscillator values as trend strength (in terms of time and not price). The Aroon indicator can also be used as a long-term bull market indicator (for example, 270-day Aroon over 20 years). The performance will then differ little from the buy-and-hold strategy, but like reduce extreme slumps.
Default setting
- Period: 25 (periods)
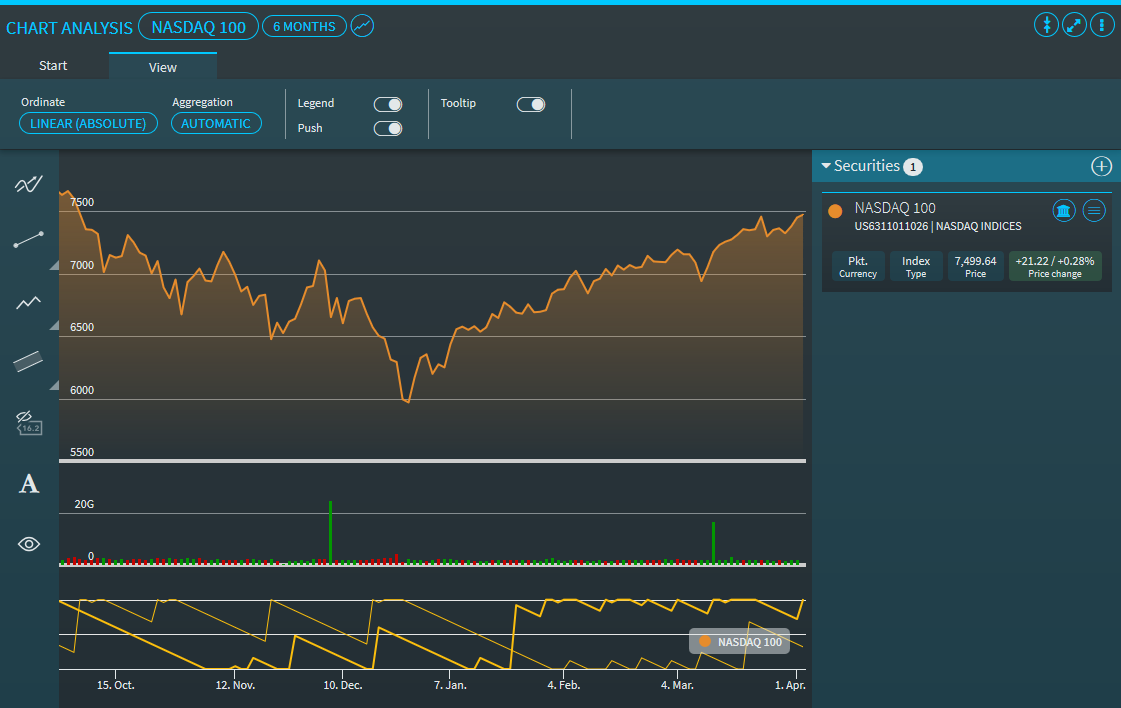
Example: Chart with Aroon