"Per share" view
In the upper part of the widget, select the corresponding security from the first drop-down list, and then select the "Per share" view (default) from the second drop-down list.
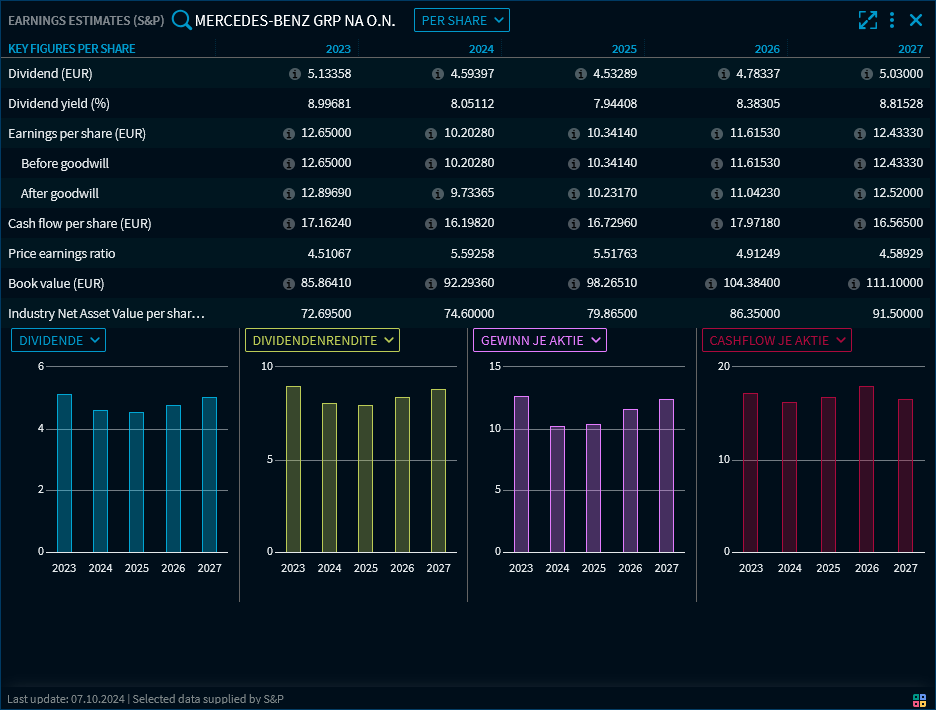
In the "Key figures per share" section, you see the earnings estimates per share for 5 years. The key figures in the table are also visualised in the charts below. With the drop-down lists above the charts, you can select and view all the key figures of the table.
Point to a bar in the chart to see the exact values.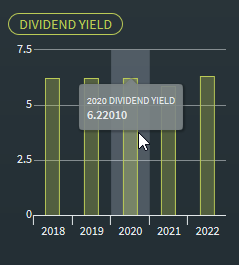
The following estimates are available in the "Per share" view of the "Earnings Estimates" widget:
- Dividend (related currency)
- Dividend yield
- Earnings per share (related currency)
- Earnings per share before goodwill
- Earnings per share after goodwill
- Earnings per share "Post Event Cons."
- Cash flow per share (related currency)
PE (Price/earnings ratio)
Book value (related currency)
- Industry Net Asset Value per share (related currency)
When saving the dashboard, the currently selected values of the bar charts are saved so that they are preselected the next time you open the dashboard.
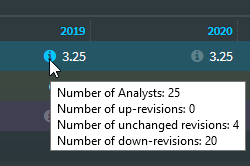
Point to the icon next to each the estimate values to show detailed numbers of the underlying estimates in a tool tip.