"Performance" view (historical performance of the portfolio)
Select the "Performance" view in the view drop-down list to display the development of the portfolio as a performance chart.
In the first drop-down list, you can select the following values for display:
- Portfolio value (default setting)
- Portfolio allocation abs.
- Portfolio allocation %
- Securities account value
- Change overall
- Change overall in%
- Portfolio vs. benchmark
- Portfolio comparison
Using the second drop-down list, you can quickly choose between the following time periods for display:
- 1 month
- 6 months
- Current year
- 1 year
- 3 years
- 5 years
- 10 years
In addition, you can also configure any individual time periods via the integrated calendars in the "From" and "To" fields.
If a new transaction (buy, buy to add or (partial) sale) with a date in the past is recorded, then the chart of the historical portfolio performance is recalculated accordingly. The charts are end-of-day charts, so the last data point corresponds to the portfolio valuation based on the last closing prices.
You can hide or show the individual chart lines for securities account value or buy amount. Simply click the corresponding entries in the legend below the chart.

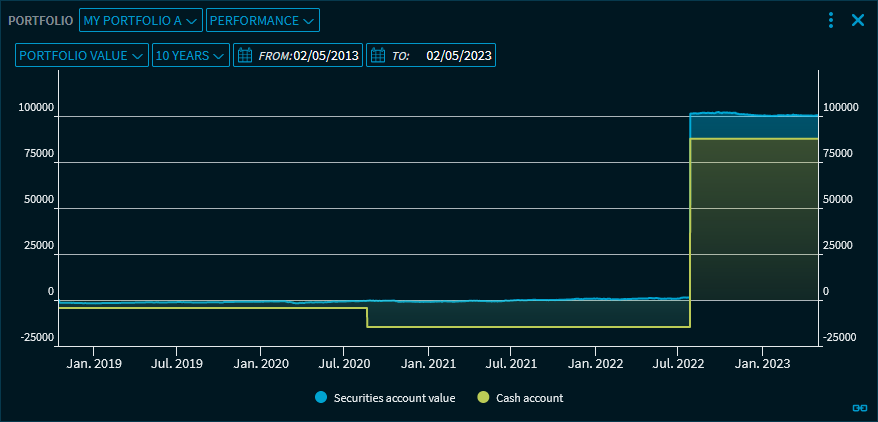
"Performance" view - portfolio value
The "Portfolio value" chart shows the historical performance of the portfolio as a stacked chart of the securities account value and the cash account balance.
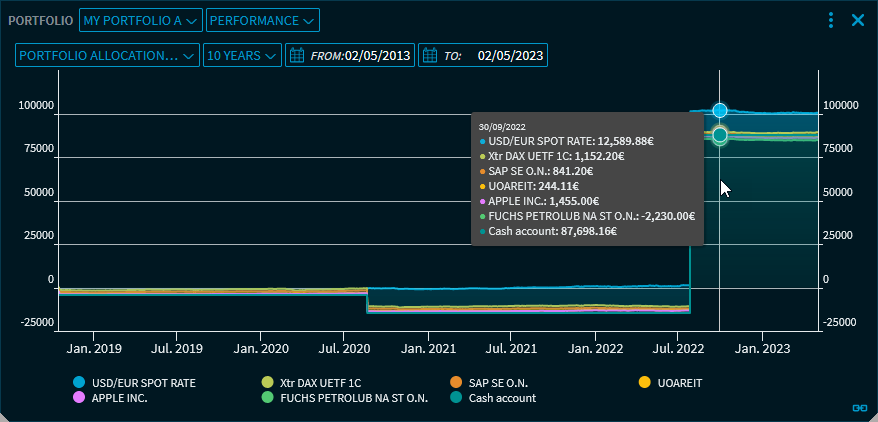
"Performance" view - portfolio allocation abs.
The "Portfolio allocation abs." chart shows a stack chart of the historical performance of the individual portfolio positions.
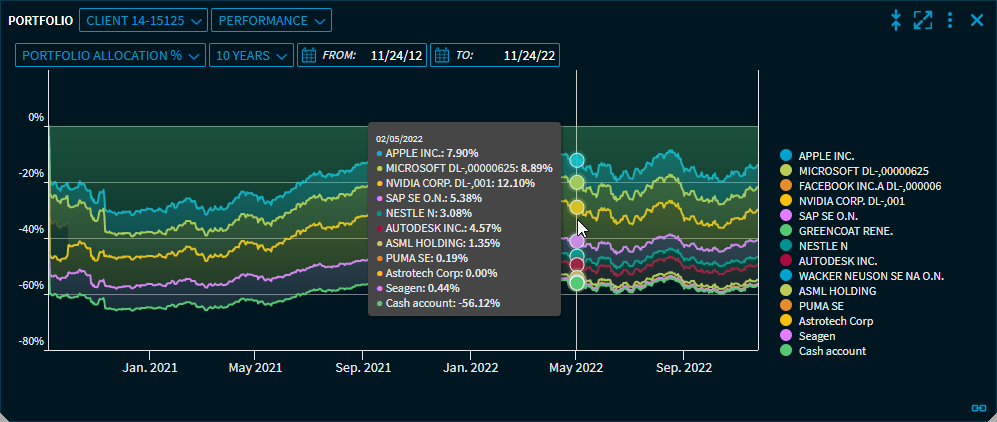
"Performance" view - portfolio allocation %
The "Portfolio allocation %" chart shows a stacked chart normalised to 100% of the historical performance of the portfolio positions. This makes it possible to analyse the percentages of the individual positions in the overall portfolio historically.
"Performance" view - Securities account value
The "Securities account value" chart compares the development of the securities account value with the buy sum.

"Performance" view - total change

"Performance" view - change in %

"Performance" view - Portfolio vs. benchmark
The "Portfolio vs. benchmark" chart allows to compare the portfolio performance with any individual security, for example a benchmark index such as the EURO STOXX 50.
If you have selected the "Portfolio vs. benchmark" entry from the first drop-down list, you can determine the desired benchmark and the corresponding quotation (place and currency) via two further drop-down lists that are now visible.
If you have not yet entered any deposits for the portfolio, the following message appears when you select this view:
"An initial account deposit for this is required for this view. This is the reference value for the calculation of the portfolio performance in percent. Please switch to the "Cash account" of portfolio "XYZ" and make an account deposit there. It makes sense to have a deposit date on or just before the first security purchase.
"Performance" view - Portfolio comparison
The "Portfolio comparison" chart enables a comparison of the portfolio performance with any other portfolio.

If you have selected the "Portfolio comparison" entry in the first drop-down list, you can select the desired comparison portfolio by using another drop-down list that is now visible.
If you have not yet entered any deposits for a portfolio, the following message appears when you select this view:
"An initial account deposit for this is required for this view. This is the reference value for the calculation of the portfolio performance in percent. Please switch to the "Cash account" of portfolio "XYZ" and make an account deposit there. It makes sense to have a deposit date on or just before the first security purchase.