"Analyst Recommendations" view
In the upper part of the widget, select a security from the first drop-down list, and then select the "Analyst Recommendations" view.
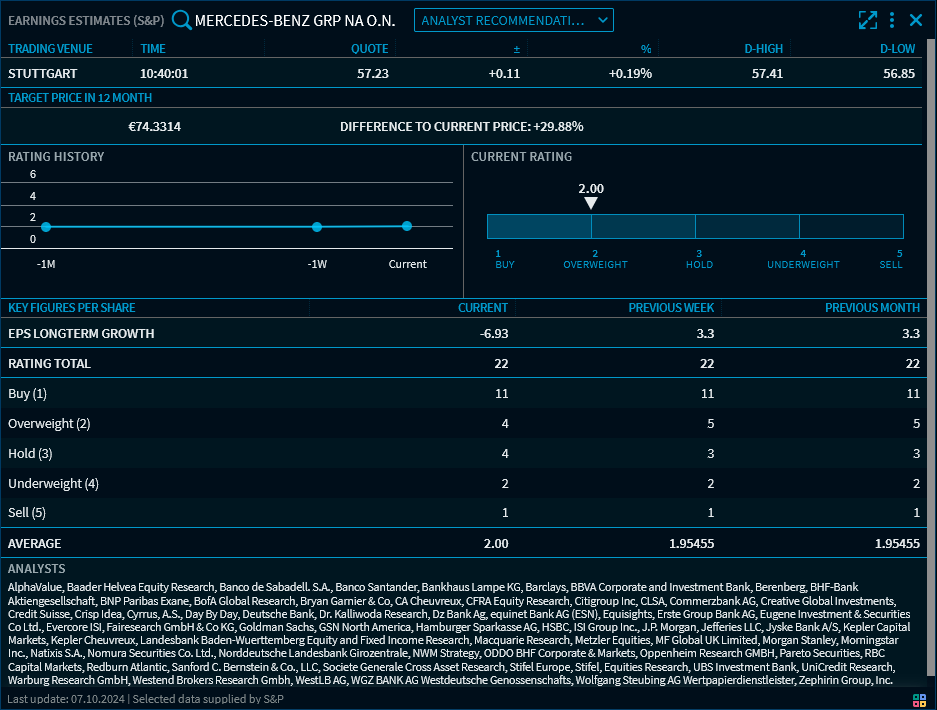
In the upper area, you see the current value for the price target in 12 months and the relative difference to the current price. An arrow symbol indicates the expected direction of the price.
In the "Key figures per share" section, you see the number of ratings and their distribution for the "Current", "Previous week" and "Previous month" periods. The numbers in the table are also visualised in charts providing a historic and current view.
The following data is available in the "Analyst Recommendations" view of the "Earnings Estimates" widget:
- Rating total
- Total of ratings with the "Buy" recommendation (value 1)
- Total of ratings with the "Overweight" recommendation (value 2)
- Total of ratings with the "Hold" recommendation (value 3)
- Total of ratings with the "Underweight" recommendation (value 4)
- Total of ratings with the "Sell" recommendation (value 5)
- Calculated average value
- Analysts
The current average is shown in the "Current rating" graphic.

In the example, the average value is calculated as follows:
2.00 = (11*1 (Buy) + 4*2 (Overweight) + 4*3 (Hold) + 2*4 (Underweight) + 1*5 (Sell))/22
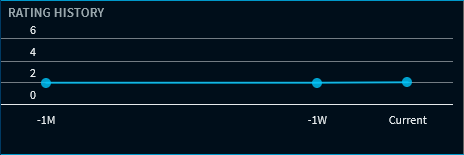
Similar to the table, the "Rating history" chart shows the average values for the "Current", "Previous week" and "Previous month" periods. Point to a data point in the rating history to see the corresponding values.