Analytics widgets (WTK)
The Analytics widgets (WTK) are briefly presented in the following sub-chapters.
All these widgets support grouping and drag & drop of securities.
Analytics: Infront GPRV
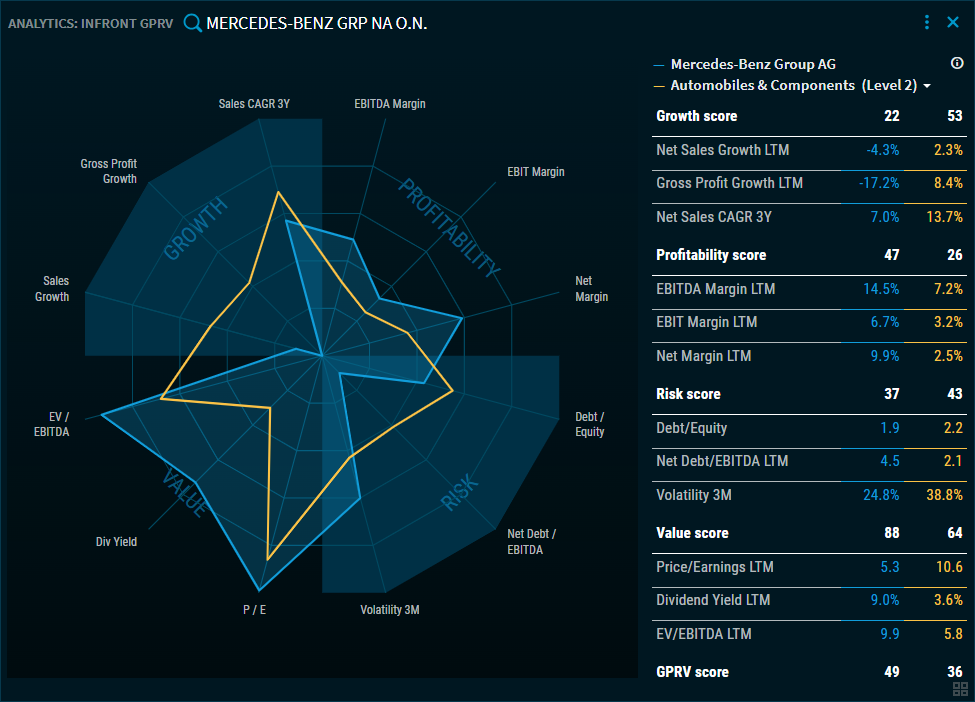
The “Analytics: Infront GPRV” widget shows the GPRV analysis for the selected company.
“GPRV” is a patented instrument for assessing the relative value of listed companies based on fundamental analysis. “GPRV” stands for “Growth Profitability Risk Value”.
ESG – Best companies in sector
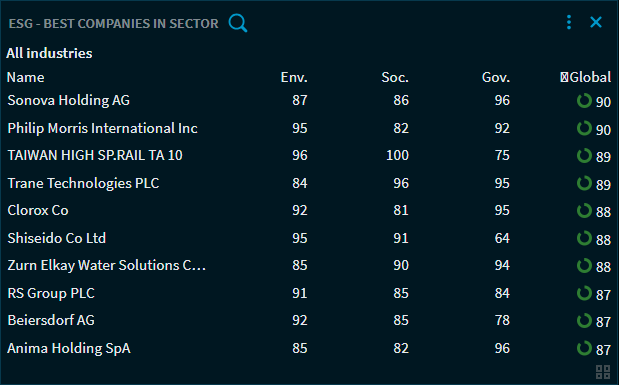
The “ESG - Best companies in sector” widget shows you the companies with the best ESG ratings in the respective sector as well as the average ESG score for the sector.
Use the sector selection list to select the desired industry:
All industries (default setting)
Consumer consumables
Consumer durables
Energy
Financials
Healthcare
Industrials
Materials
Real Estate
Technology
Utilities
By default, the 10 best companies in the industry are displayed; you can use the "Global" column to reverse the sorting and display the worst companies.
You can then use the familiar security search at the top of the widget to search for companies and analyse their sector. Once you have selected a security, you can choose between "Level 1" and "Level 2" by clicking on the sector selection list.
Example: The security "SAP SE O.N." is in the "Technology" sector ("Level 1") and there in "Software & Software Services" ("Level 2").
Financial Statements
The “Financial Statements” widget shows you the annual or quarterly figures of the selected companies.
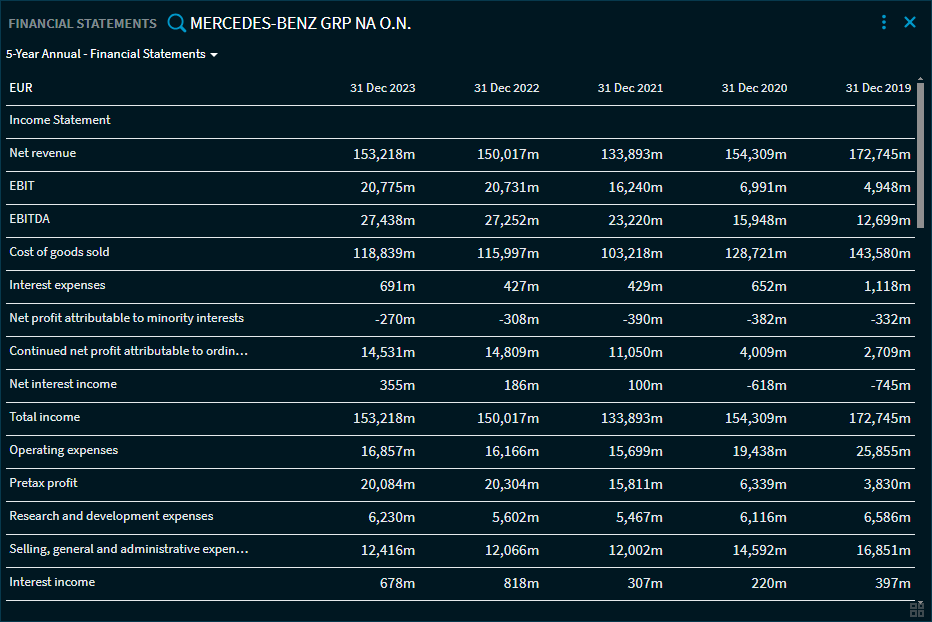
Use the selection list to switch between annual financial statements and quarterly figures.
Key Figures
The “Key Figures” widget shows you the Analytics key figures of the selected companies.
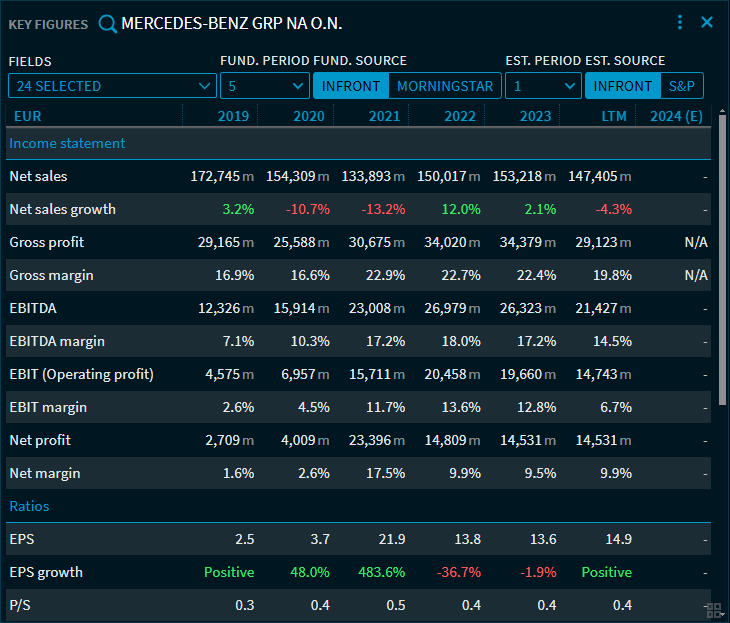
You can use the security search at the top of the widget to search for shares and then use the selection lists to select the fields (key figures) and the number of fundamental periods (0-5) and estimation periods (0-3) to be displayed.
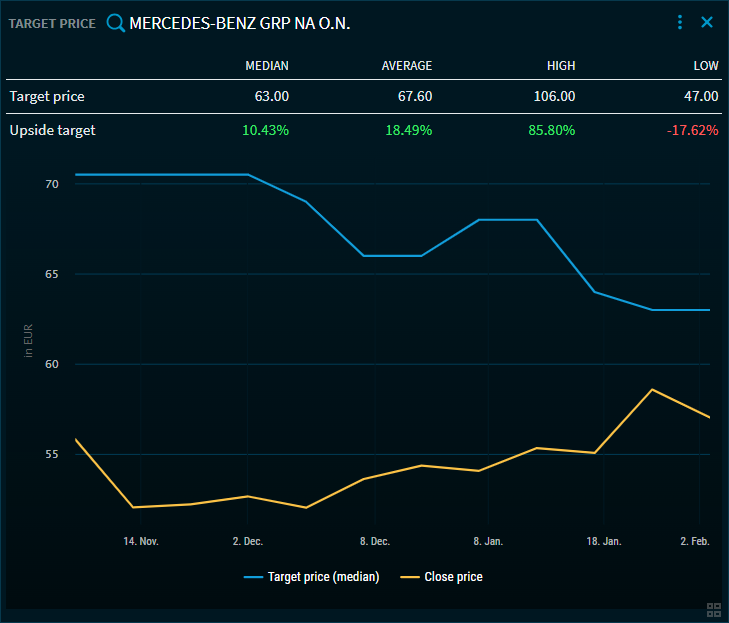
Target Price
The “Target Price” widget shows you the target prices of the selected companies.
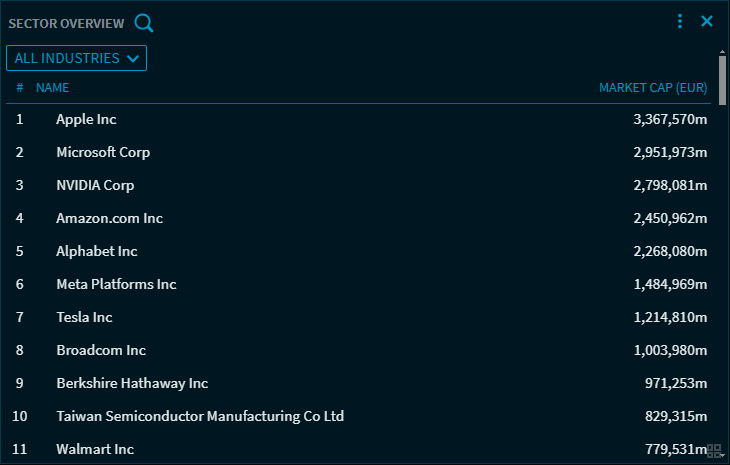
Sector Overview
The “Sector Overview” widget shows you the 100 companies with the highest market capitalisation in each sector.
Use the industry selection list to select the desired industry:
All industries (default setting)
Communication services
Consumer discretionary
Consumer staples
Energy
Finance
Healthcare
Industry
Information technology
Materials
Real estate
Utilities
You can use the familiar security search at the top of the widget to search for companies and analyse their sector.
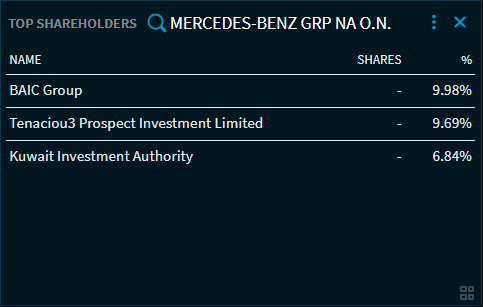
Top Shareholders
The widget “Top Shareholders” shows you the largest shareholders of the selected companies.
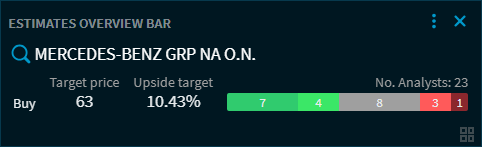
Estimates Overview Bar
The widget ‘Estimates Overview Bar’ shows you the available estimates of the selected companies.
Company Description
The “Company Description” widget shows you the company descriptions of the selected companies.
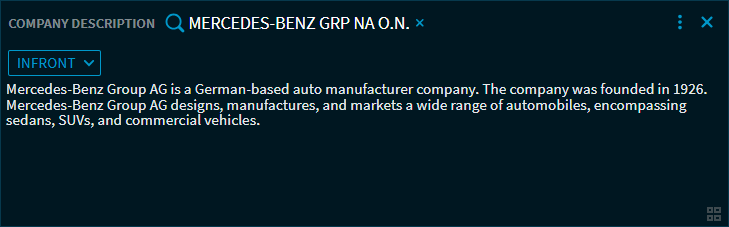
You can select the following sources from the selection list:
· Infront
· S&P
· Morningstar